CHETNA - 100 Indian Cities
City-wise High-resolution carbon Emissions Tracking and Nationwide Analysis
India is the third-largest energy consumer globally, contributing about 7% of global greenhouse gas (GHG) emissions. With a projected 90% increase in its urban population by 2050, energy consumption and GHG emissions are expected to surge in urban areas. In 2018, India's per capita GHG emissions were 2 metric tons, ranking 74th globally, with a 6% annual increase over the last decade. Today, approximately 75% of the power production in India is met by coal, with new capacity being added. Renewables represent 19% of the power generation and show an increasing trend of installed capacity.
India will shift from a low-income-based economy to a middle-income economy, 80% of households will be middle-income, increasing ownership of electrical appliances and vehicles by 15%-20% by 2030. India is a hot country and has been affected by an increase in the duration and frequency of heat waves affecting the urban population. Increased heat exposure and higher population income lead to a fast surge in the use of air conditioning devices with annual growth rate of around 15% projected to continue until 2028, which is expected to boost the electricity demand.
India has the opportunity to curb energy demand and emissions through low-carbon urban planning, crucial for meeting its Paris Agreement commitments. Reliable data on urban energy use and emissions is needed to track progress. India has pledged to reduce GHG emissions per unit of GDP by 33%-35% by 2030, based on 2005 levels, but lacks specific targets for urban emissions due to insufficient data.
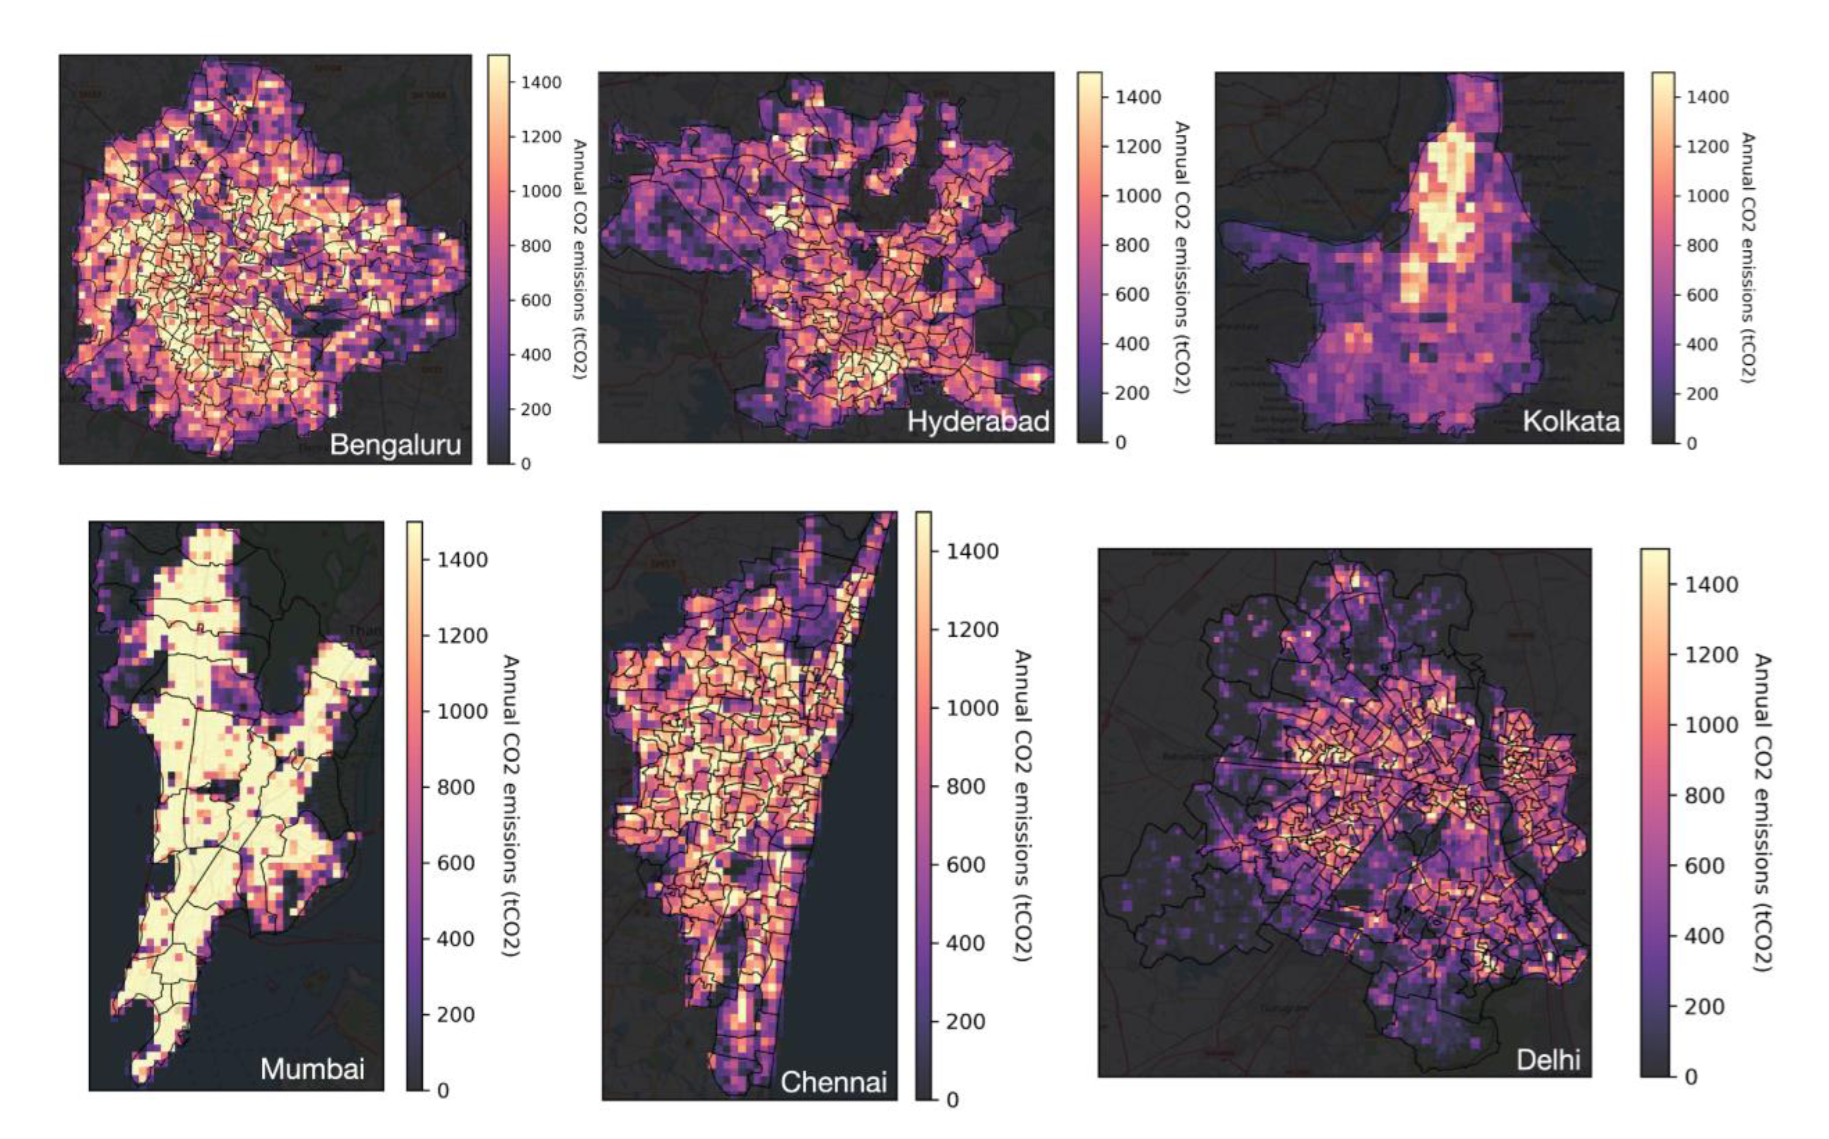
CHETNA, a succeed project of Carbon Monitor 2.0, aims to leverage artificial intelligence and new datasets to deliver high resolution daily CO₂ and pollutants emission from power, traffic, residential, industrial and aviation sectors down to street and building block level,s for 100+ Indian cities. Near real-time and high spatial resolution data is essential for accurately quantifying urban carbon and pollutants emissions because it captures the dynamic and complex nature of urban energy use and emissions. These data are complementary to existing aggregated information only available at state or country level.
The urban emissions maps from CHETNA will be updated monthly, offering a consistent view of recent trends across sectors and cities. CHETNA will also generate high spatial-temporal resolution emissions of air pollutants co-emitted with the combustion of carbon fuels, to investigate the air quality co-benefits or urban low carbon pathways
How CHETNA select cities…
CHETNA gather high resolution datasets from various sources, including census data, surveys, building footprints, power generation data, individual vehicle mobility data, and high-resolution satellite imagery. Using machine learning, we identify the emission related activities with sectoral model based on buildings categorization, industrial activity detection, traffic flows and power generation by each large power plant.
Sectoral Report
Last update: Dec 0, 2023
Last 30 days - Previous year